Reading barcodes from color images
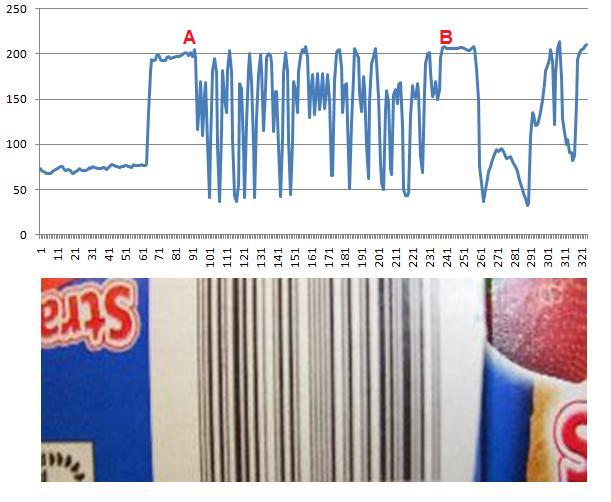
The graph below is a representation of a single scan line bisecting the image of the barcode shown underneath. The scale on the Y-axis represents pixel values with distance in pixels on the X-axis. Note that the value of a pixel is derived from the RGB value using the formula (R + G + B) / 3. The peaks on the graph represent white spaces between bars and the troughs represent the black bars.
Now, the barcode shown below consists of 30 black bars, and with care it’s possible to count 30 troughs between points A and B along with the 29 peaks between the troughs. The lowest peak between A and B has a value of 159 and the highest trough has a value of 145. This means that only color threshold values between 146 and 158 will stand a chance of decoding the barcode value on this scan line. If the difference between the lowest peak and the highest trough can be increased then so are the chances of an SDK of being able to decode the barcode value.
